Table of Contents
Matplotlib Tutorial
Table of Contents
Matplotlib Tutorial
Matplotlib Scatter Plot in Hindi
Scatter Plot
Scatter Plot एक ऐसा graph है जिसमे data points को individual dots के form में plot किया जाता है, बिना उसने किसी line से connect किए। ये 2 variables के बीच का relation (correlation) दिखाता है।
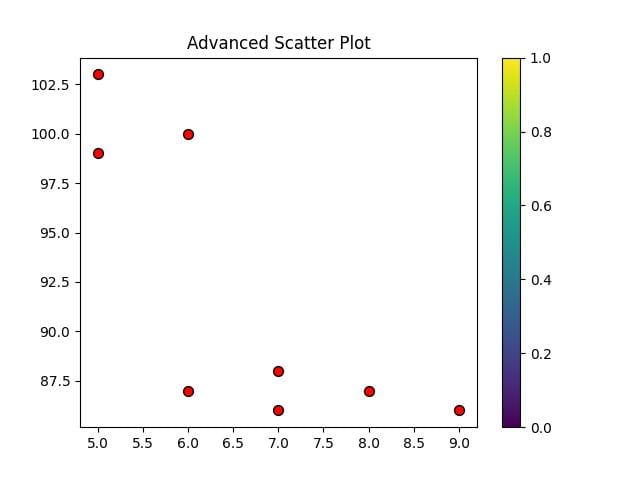
How to draw Scatter Plot in Matplotlib
Matplotlib में scatter() function का use करके Scatter plot को बनाया जाता है।
Important Parameters of scatter() function
`c` (color): Har dot ka color set karta hai. For Example plt.scatter(x, y, c=’red’)
`s` (size): Marker (dot) ka size set karta hai (default = 20). For Example plt.scatter(x, y, s=100)
`marker`: Dot ka shape change karta hai (`’o’`, `’s’`, `’^’`, `*` etc.). For Example plt.scatter(x, y, marker=’^’)
`alpha`: Transparency set karta hai (0.0 → fully transparent, 1.0 → fully opaque). For Example plt.scatter(x, y, alpha=0.5)
`edgecolors`: Marker ke border ka color set karta hai. For Example plt.scatter(x, y, edgecolors=’black’)
`cmap`: Agar color values diye gaye hain (`c` me list/array), to ek color map apply karta hai. For Example plt.scatter(x, y, c=z, cmap=’viridis’)