Table of Contents
Matplotlib Tutorial
Matplotlib Tutorial
Matplotlib Bar Plot in Hindi
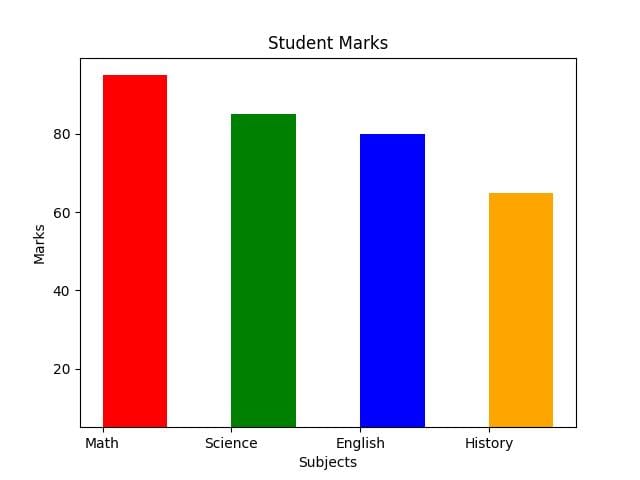
Bar Plot
Bar Plot एक ऐसा graph है जिसमे rectangular bars होते है जो जिनकी height किसी data की value को represent करता है, इसका ज्यादा use एक categorical data visualization में किया जाता है।
How to draw Bar Plot in Matplotlib
Matplotlib में bar() function का use करके Bar plot को बनाया जाता है। अगर हमे horizontal plot बनाना हो तो barh() का use करेंगे।
Important Parameters of bar() & barh() Function
height: height parameter में हर bar की Height assign की जाती है इसमे values को एक list में देना होता है।
For Example: plt.bar(x, height=[10,20,15])
width: width parameter में bars की Width assign की जाती है।
For Example: plt.bar(x, y, width=0.5)
botton: bar को vertically shift करने के लिए bottom value दी जाती है।
For Example: plt.bar(x, y, bottom=5)
align: bars को x-coordinate के center या edge के साथ align करने के लिए align में “center” या “edge” assign किया जाता है।
For Example: plt.bar(x, y, align=’edge’)