Table of Contents
TOC loading...
Matplotlib Tutorial
Matplotlib Tutorial
Matplotlib Box Plot in Hindi
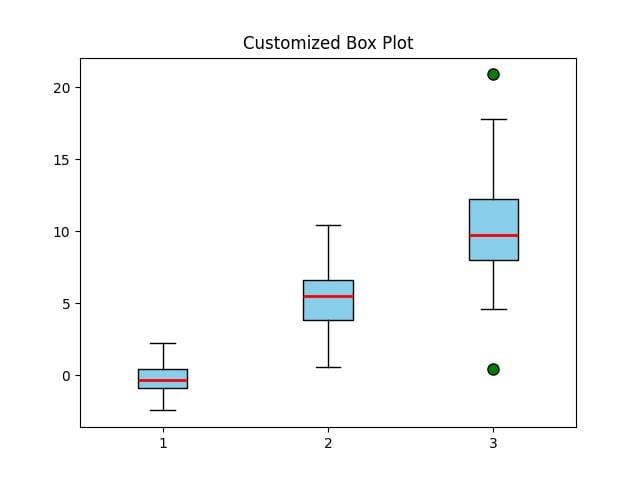
Box Plot
Box Plot एक statistical plot है जो data का distribution, spread और outliers show करता है। इसमे एक box, एक median line और whiskers (जो min और max को show करते है) होता है। इसका ज्यादा use एक data variability और outliers को detect करने में किया जाता है।
How to draw Box Plot in Matplotlib
Matplotlib में boxplot() function का use करके Box plot को बनाया जाता है।
Important Parameters of boxplot() Function
notch : ये अगर “True” होता है तो median line के around notch दिखाता है।
For Example: plt.boxplot(data, notch=True)
vert : ये अगर “True” होता है तो vertical box plot होता है, और अगर “False” होता है तो horizontal box plot होता है।
For Example: plt.boxplot(data, vert=False)