Table of Contents
Matplotlib Tutorial
Matplotlib Tutorial
Matplotlib Stem Plot in Hindi
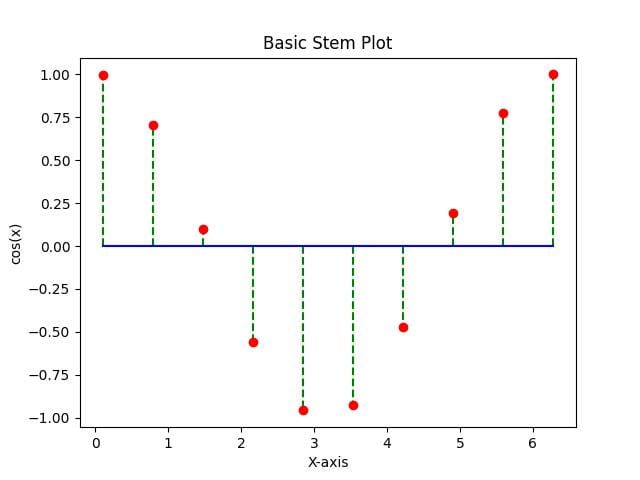
Stem Plot
Stem Plot एक ऐसा graph है जिसमे हर data point एक vertical line और एक marker के sath दिखाया जाता है। इसका ज्यादा use single processing, discrete sequences और mathematical functions को दिखने में किया जाता है।
How to draw Stem Plot in Matplotlib
Matplotlib में stem() function का use करके Stem plot को बनाया जाता है।
Important Parameters of stem() Function
linefmt : ये stem (vertical line) का format set करता है इसमे color और linestyle assign किया जाता है।
For Example: plt.stem(x, y, linefmt=’g–‘)
markerfmt : ये marker (tip) का style set करता है।
For Example: plt.stem(x, y, markerfmt=’ro’)
basefmt : ये baseline (x-axis की line) का format set करता है इसमे color और linestyle assign किया जाता है।
For Example: plt.stem(x, y, basefmt=’b-‘)
use_line_collection : इसमे “True” or “False” assign किया जात है अगर “True” हो तो efficient rendering होता है।
For Example: plt.stem(x, y, use_line_collection=True)