Table of Contents
TOC loading...
Matplotlib Tutorial
Matplotlib Tutorial
Matplotlib Histogram in Hindi
Histogram
Histogram एक ऐसा graph है जो data distribution को show करता है, data को bins (intervals) में divide करके हर bin में कितने data points आते है इसके basis पे bars draw करता है, इसका ज्यादा use frequency distribution और probability distribution को समझने के लिए किया जाता है।
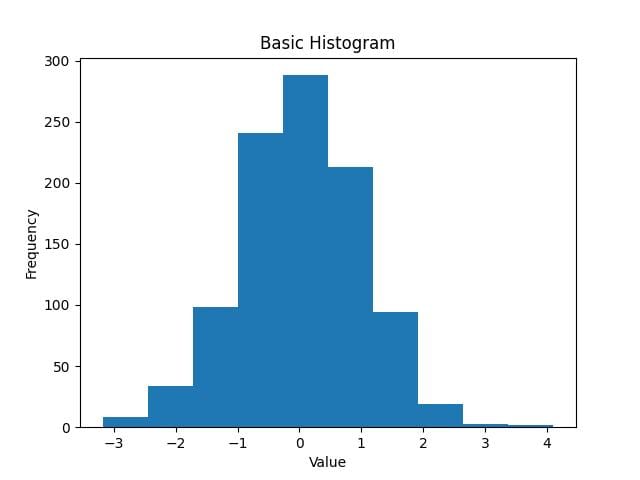
How to draw Histogram in Matplotlib
Matplotlib में hist() function का use करके Histogram plot को बनाया जाता है।
Important Parameters of hist() Function
bins: ये data को कितने intervals (bins) में तोड़ना है decide करता है। इसमे integer value assign किया जाता है।
For Example: plt.hist(data, bins=10)
range : bins के लिए min और max value set करता है।
For Example: plt.hist(data, bins=5, range=(0,50))
density : अगर ये “True” हो तो histogram को probability distribution बना देता है।
For Example: plt.hist(data, density=True)