Table of Contents
TOC loading...
Matplotlib Tutorial
Matplotlib Tutorial
Matplotlib Pie Plot in Hindi
Pie Plot
Pie Plot एक circular chart होता है, जो एक circle को slices में divide करके data के percentage या proportion को show करता है, इसमे हर slice का size उस data के proportion का show करता है। इसका ज्यादा use categorical data के visualization में किया जाता है।
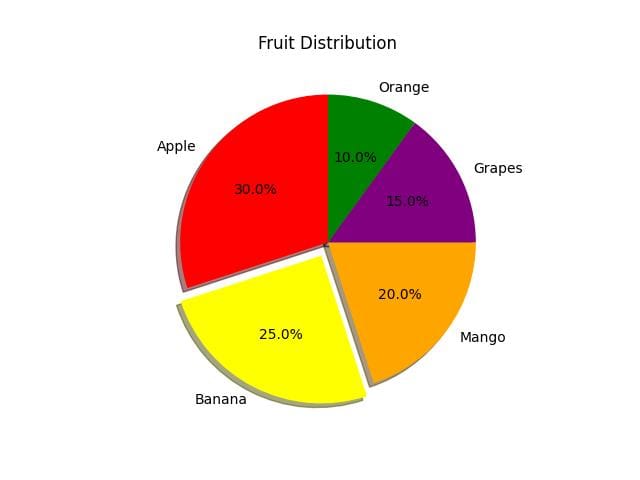
How to draw Pie Plot in Matplotlib
Matplotlib में pie() function का use करके Pie plot को बनाया जाता है।
Important Parameters of pie() Function
x: इसमे Data दिया जाता है जो एक list या array के form मे होता है। x सिर्फ एक variable है यहाँ हम कोई भी name ले सकते है।
labels: इसका use हर slice को नाम देने के लिए किया जाता है।
explode: किसी slice को pie से बाहर निकालने के लिए इस parameter का use किया जाता है।